

Dew point calculator
The dew point can be defined as the temperature from which the water vapor in the air begins to condense, producing dew, fog or, if the temperature is below 0 ° C, frost. For a given mass of air, with a certain amount of water vapor (absolute humidity), the relative humidity is the proportion of vapor contained in relation to the necessary to reach the saturation point, expressed as a percentage.
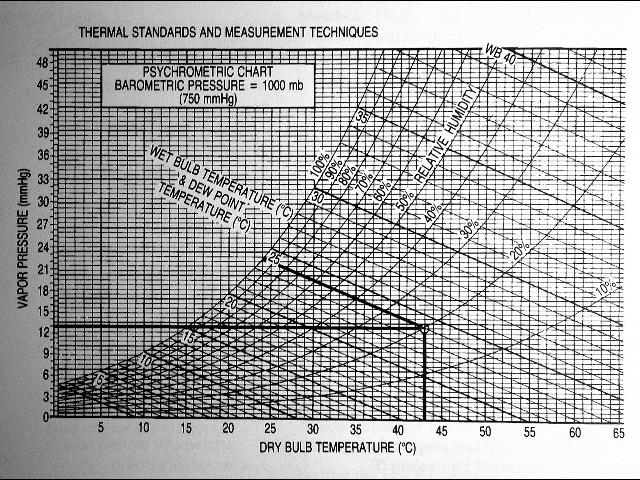
Dry bulb (Tdb) temperature (chart bottom or “x” axis) is just the measured indoor temperature measured using a standard thermometer.
Relative humidity (RH) is the amount of water in the air. We use the term “relative” humidity because the amount of water that a given volume of air can hold decreases as temperatures drop. (Think of it as cold air being more dense, squeezing water molecules out of suspension in the air.) So RH is the ratio of the actual water vapor pressure in the air to the water vapor pressure in air that is fully saturated (can’t hold any more water) at that same temperature.
Wet bulb temperature (Twb) measures the amount of water that can be taken out of the air (by evaporation) – the old “sling psychrometer” used a simple mercury thermometer with a wet cloth over the sensing bulb to measure Twb by swinging the thermometer around at the end of a string – or properly: a sling psychrometer. Really.
See the left-most curve, the 100% relative humidity line for a simple case – that’s air that is 100% saturated. So on the chart above, notice that on the left-most curve, the wet bulb temperature equals the dry bulb temperature – that is, when the air is fully saturated at 100% RH, no more air water can be evaporated out of the air.
Define Dew Point: Now the good part: the dew point (Tdp) is the temperature at which water vapor just starts to condense out of air that is cooling – for example when warm moisture-laden air contacts a cool surface inside of a wall cavity. Above the dew point the moisture stays in the air. At or below the dew point moisture leaves the air and in buildings, condenses on the cooler surface that the air is contacting. This also means that if you are measuring the relative humidity in a room, the RH number only has meaning if you measure the room temperature at the same time and location.
That’s why, for example, when measuring basement humidity we will get different RH measurements in the center of the room than we will find right against a cool foundation wall.
Dew Point Example: in the chart below, if the room temperature (Tdb) is 43 degC and the relative humidity (RH) is 20% (the curved line reading up from 43 degC) then the dew point is 15 degC (reading horizontally across to the left-most curved line and noting the dew point temperature scale set along that curve).
Dew Point Example 2: in the psychrometric chart given above, read up from 50 degC dry bulb temperature to the 20% RH curve, then follow the horizontal line from that point to the left to the outermost curve on the chart.
To convert temperatures from Fahrenheit to Celsius use: Tc = (5/9)*(Tf-32) where Tc= the Celsius temperature and Tf= the Fahrenheit temperature.